Sep 162011
 

Silver saw a steep drop from $50 to $32 in the month of May and the rise post that has been in a corrective fashion.

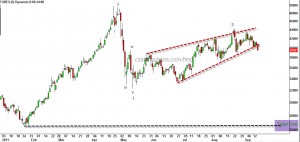
Silver - rising wedge

The above chart of silver shows a rising wedge pattern with a typical throw-over to the upside. Yesterday's close was well below the bottom of the rising wedge and this should usher in a sharp down move for the industrial metal probably before the end of this month. Looking at the chart from an Elliott wave perspective, silver is probably in its powerful 3rd wave or C wave which has the characteristics of wave 3. At $26.7 the first leg of the decline from 50 would be equal to the move from 44.27 (and hence A=C), the August peak, which seems like the minimum drop that is likely for silver. Also the $26 zone is the previous 4th for Silver.

Naturally, some of us would be thinking, "what happens to gold now?"

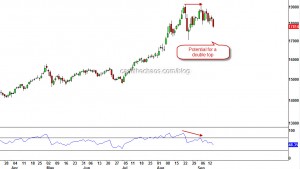
Gold Daily Chart - Potential for a double top

Here too, it is obvious that Gold is running into troubled waters. A fake print above 1913 high, momentum disagreeing with the new high in price are all tell-tale signs of exhaustion. A close below 1763 or an intraday drop below 1705 would complete a double top for gold and should draw prices at the very least to 1480.

Given the fact that the Dollar Index too had a breakout to the upside just a few days ago,  you might want to pay considerable attention to these signals in the precious metals space.
Apr 272011
 

Silver's sharp decline after hitting a multi-decade high warrants close attention.

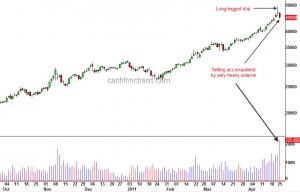
Silver- Daily Charts

The daily chart of silver above marks the "long-legged doji" which is a key warning of sign of an impending reversal. Moreover this pattern (a) has occurred after a prolonged and parabolic rise in silver (b) has seen follow through selling on very heavy volumes and (c) has faced resistance at the 1980 highs. These are mouth-watering signs for much lower prices for silver.

However I will probe this set up with a very small short trade - the Dollar Index has shown no signs of reversal and is merely consolidating near the lows. Unless the green-back turns up this might turn out to be just a fleeting drop in an up-trend.

Topping signs in Precious metals, CRB Index, Crude

 Commodities  Comments Off on Topping signs in Precious metals, CRB Index, Crude
Dec 082010
 

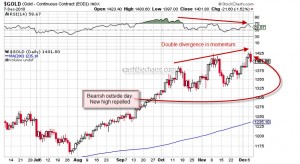
Gold - Daily Charts

As can be seen from the above charts, the climb up for gold has been loosing lustre, at least for the intermediate term. Each successive peak has been on declining momentum.

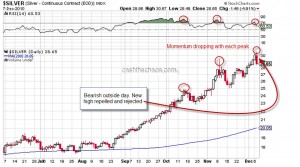
Silver - Daily Charts

As one should expect the picture is similar for silver, double negative divergence just as in Gold. Also both these precious metals made new intraday highs only to be repelled lower and rejected by the market - a bearish outside day formation.

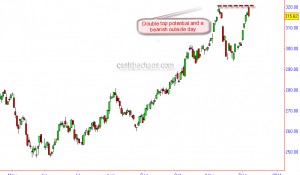
CRB Index - Double Top potential

The CRB index has also formed a bearish outside day right the previous swing high and thereby raising the possibility of a double top formation.

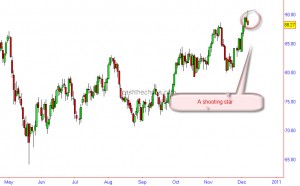
Crude Oil forms a shooting star

A shooting star pattern is visible on Nymex crude. The momentum here too has been diverging negatively with the price peaks.

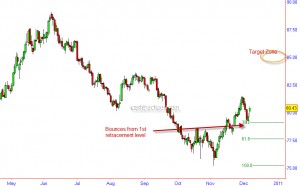
Dollar Index - Bounces from 38.2 Fib retracement

A look at the charts of the Dollar Index, shows that the Index has probably resumed its uptrend after a 3 day corrective decline. The index is bouncing from its first fibonacci retracement level. Over next 4-6 weeks a level of 85 is the price objective for this currency basket.

Barring an immediate reversal in the above markets( though not impossible), one should expect the negatives to start trickling into equity markets.