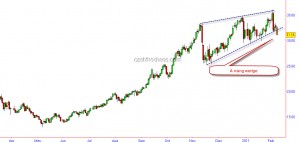
Raw Sugar had been on a tear and the run may have come an end. The chart below shows the commodity breaking out of a rising wedge.
Wedges are ending patterns and have a fairly high degree of reliability. Also from May lows, I can count 5 waves to the February highs and Wave 5 is 1.6 times Wave 1 which is a Fibonacci relationship. If the commodity declines quickly over the next couple sessions, this would be a reiteration of this sell signal. Very interestingly, Raw Sugar has some seasonal cycle working for the last few years around February - top in 2010, 2008, 2006, 2003 secondary top in 2007, 2005 and bottom in 2004 and 2000.
