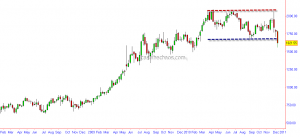
The weekly charts of Hero Honda shows the obvious resistance at 2100. After failing to clear this level for the third time, the stock has plunged below the previous support. A normal measured move for the above kind of price action would be a move to somewhere around 1100 (the width of the previous price band). If you are an Elliot Wave fan, one can also count clear 5 waves to the highs and the current move is probably C leg or wave 3 to the downside.
So unless there is an immediate reversal with volumes, this might be just the beginning of a bigger fall for the stock. The stock is oversold in the short-term and may see a bounce to 1700's.
