Sep 122011
 

Some of you have requested my short term view on Nifty and here goes.

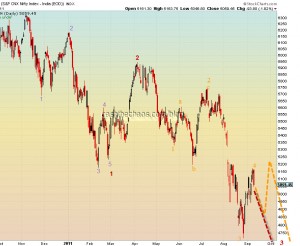
Nifty Daily Charts

The upward correction that started from 4720 saw some serious selling pressure on Friday. It is possible that this correction may have ended as per the red scenario and a new low may be coming. Alternately, the upward correction may have a little more juice before another new low for the year comes through(orange scenario). So if anyone decides to go short, they need to do be ready with money management strategy around the 4900 zone of Nifty.

While we are here let us also look at the INR charts.

INR daily charts

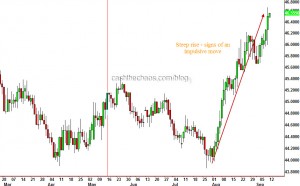
The pace and steepness of the USD's appreciation against the rupee has all the signs of an impulsive move. You might want to go back and refer to our Aug 26th post on the INR for the bigger picture.

As some of you would have noticed from the comments section, I consider the breakout in the dollar index a significant contributor to the global bear case.

Dollar Index - Daily Charts

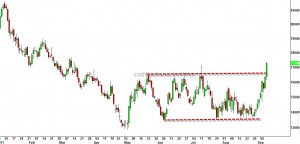
After building a base for 3 months, the dollar index has broken out of a range. This is likely to accentuate the risk aversion across various asset classes.

Given the strength in the dollar index and weakness in rupee - I will not be surprised if a new low comes through in the month of September for equity markets.

PS: Ill be on Bloomberg-UTV today at 8:30 IST.
Dollar Index – another bounce on the cards?

 US Markets  Comments Off on Dollar Index – another bounce on the cards?
Feb 072011
 

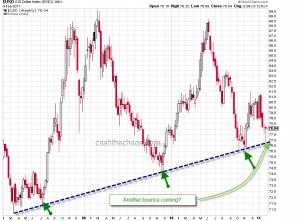
The trendline highlighted on the weekly charts has been a solid support for the Dollar Index despite consistent efforts by the Federal reserve to debase the currency.

Dolla Index - Weekly Charts

An ascent past 78.8-79 would increase the odds of this rally having more legs and clearing the 200 MA( currently placed at 81.61). The much awaited correction for the US markets could be close and those emerging markets stocks which have already been battered (like India) are likely to head even lower.

Sep 272010
 

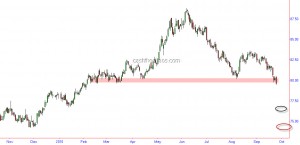
Last week, the Dollar Index breached an important support, the 80-79.5 region (highlighted), negating one possible wave count for a stronger and higher USD.

Dollar Index Daily Chart

The markets seem to suggest that Ben Bernanke was not just merely using empty rhetoric when he said deflation will not be allowed to occur. The reserve currency is getting debased. We already saw some intervention on the Yen from BOJ and we should expect more such actions from other monetary authorities around the world. One can also see Gold hitting new highs across almost all the currencies indicating potential or real drop in their values.

While in the past the US Fed has managed to prop the markets up by such debasement, my sense  this time around is that it will work initially before stocks and the US Dollar sink in lock-step.  As can be seen from the above charts, the Dollar Index gets support around 76.5- 74.2 and the all-time low of 71. I will be surprised if the world does not slip into a currency crisis below 71 Dollar Index. Until that happens, enjoy and embrace the ride in the stock markets around the world while being prepared for the future.