Wall Street Sequel: Which way for the markets?

 Uncategorized  Comments Off on Wall Street Sequel: Which way for the markets?
Sep 232010
 

Wall street: Money Never Sleeps is getting released in the US today. This is the third movie titled wall street. The first feature film was released in Dec 1929  and the second one ( Chart-buster starring Charlie Sheen and Michael Douglas) was released in Dec 1987. Strangely, markets saw a big crash in 1929 as well as in 1987.  In 1929, after the October crash, markets rallied in a counter-trend for a few month before embarking on the biggest decline in the history of the US markets. However in 1987, the crash of October 1987 marked a major low for the US markets and US markets rallied from there on.

Interestingly, there was a mini crash in May 2010 and there is still a bit of mystery surrounding this crash.  So will the 3rd wall street feature film mean anything for the US markets? Will it be like 1987 0r 1929? While this need not be an indicator of anything but nevertheless will be an interesting theme to watch out for.

Inverse Head & Shoulder breakout

 Uncategorized  Comments Off on Inverse Head & Shoulder breakout
Sep 212010
 

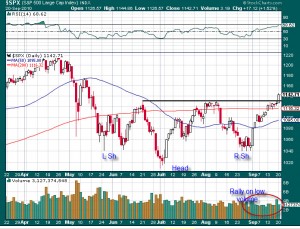
The S&P busted through the resistance level at 1131 and in the process completed the inverse head and shoulder pattern. While conventional measuring techniques provide a price objective of 1250, it is another topic if the S&P can take out the April high of 1220 and would go all the way to reach this price objective. I will try to do a post on this later after some more research.

S&P 500 - Inverse H&S breakout

In my Sept 2nd post, I did alert to the inverse head and shoulder breakout as one of the possible scenario and we also took note of several false breakouts  in the same post. Given that all through July-September the S&P has been rallying on low volume, we should be watchful if the market repeats this choppiness one more time. I'm not saying it will but a good trader is one who is prepared for all scenarios.

Sep 082010
 

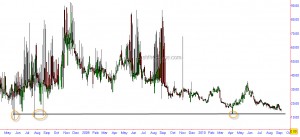
The readings on NSE India VIX are approaching extreme levels. Although they haven't yet reached the most extreme readings since its inception but it is at its lowest readings on a closing basis. The current level of complacency is much more than it was during the January 2010 highs.

India VIX - Daily Charts

As can be seen from the chart above such low readings have often corresponded to significant peaks of April highs, July/Aug 08 highs and May 08 highs. Had it not been for the limited history of India VIX, I will be sitting with a bucket load of puts.  But being a conservative trader, I prefer to act on things with much longer history. If aggression is your cup of tea here is a chance to pre-empt the market. Nevertheless, this is a chart that might be worth every trader's attention.

US Markets – Is the down trend under risk?

 Uncategorized  Comments Off on US Markets – Is the down trend under risk?
Sep 022010
 

As a trader it's very important that one remains open minded in the market to see the patterns and trends that are evolving. With the S&P surging to one of it's sharpest gains in the last 2 month's, I did try to take a view on markets like someone starting today on a clean slate.

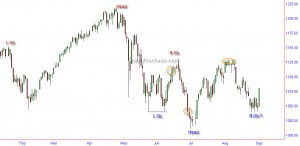
As can be seen from the chart below - there are 2 competing patterns that are trying to overrun each other's lines of defence, namely the bearish head and shoulder pattern(red) and the bullish (potential) inverse head and shoulder pattern (IHS - blue). What is also obvious is that there have been 3 breakouts (circled in orange) that have not seen a follow through.

S&P 500 Daily Charts

In order to anticipate how this stalemate is likely to resolve, lets try to look at the longer term market structure using Elliott wave analysis.

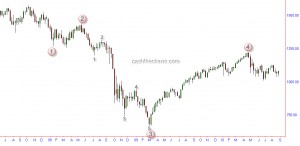
S&P weekly charts - EW Count

It can be seen that the S&P is still progressing in its fifth wave and is essentially in a down trend. So one should expect this rally to fail somewhere along the way.  Even if the S&P does manage to break out of the IHS neckline at 1131, the probability of it failing under 1220 looks remarkably high. The reason being that the price and time have squared at 1220 high in April and (unless my calculations are wrong ) 1220 is likely to be a multi-year high. Also, a retest of the high of at 1220 would once again be within the template of 1937-38 bear market structure (see April 28th post).

So, I see this as a short term trading opportunity on the long side though I still do not find any overwhelming reasons to be bullish over the medium- long term. Also, my cycle analysis is pointing to a cycle high on the 6th of September (with 1 day tolerance) and I will be watchful to see if the market is coming under pressure under the obvious resistance levels of 1094-1100 and 1131.

PS:  I have looked at the US markets in isolation using the S&P. The SOX is well below its July lows and Russell 2000 has retested its July lows - these under performances are usually good leading indicators.

Sep 012010
 

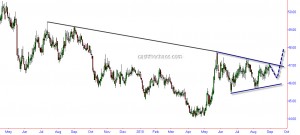
As mentioned in my August 27th post, the Indian Rupee has hit the upper borders of the trendline and looking at today's SGX Nifty at pre-open and early currency market moves, it may be moving along expected path. This is shown in the chart below:

USDINR Daily Chart

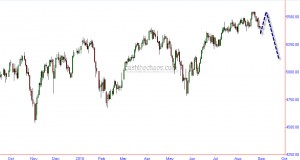
So if USDINR charts this path, the stock markets should take an inverse path - that either stalls under highs of August or makes a high slightly above 5600 and pulls lower sharply when INR breaks out of the symmetrical triangle. The chart below shows this scenario on Nifty.

Nifty Daily Charts

Is the Auto sector topping out?

 Uncategorized  Comments Off on Is the Auto sector topping out?
Aug 302010
 

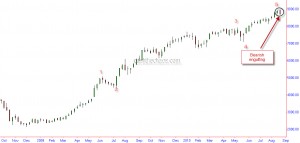
I did mention in my friday's update that a close below 5452 would be a bearish signal for the Indian market. Besides an engulfing bearish candle pattern on the Nifty,  one other key index in this bull run,  the auto index has also formed a bearish engulfing candle on its price chart.

BSE Auto Index - weekly chart

In March 09 when the broad markets were trying to form a bottom, this sector was already on its first leg of the rally. As can be seen from the chart above, besides the candle pattern, the advance looks like a completed 5 wave advance indicating a possible exhaustion.

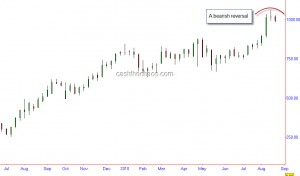
Looking at the chart of Tata Motors gives a similar picture. Further negatives likely for Tata Motors if the stock starts trading below the previous week's low of 983.

Tata Motors - weekly chart

 Posted by at 2:25 am

Channel lines puts pressure on Nifty

 Uncategorized  Comments Off on Channel lines puts pressure on Nifty
Aug 272010
 

First post from Singapore - settling down here took a bit longer than anticipated. OK, back to markets 🙂

As can be seen from the chart below, the channel lines are putting pressure on the Nifty.
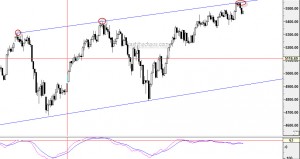
Nifty Daily Chart

Also, momentum peaks continues to disagree with the new price highs.

In my March 8th post, I had projected that Nifty should reach a minimum target in the region of 5600 but we dropped that stance in April expecting a correlated breakdown along with US markets. After initially declining to 4800 on the Nifty, Indian markets showed great resilience and outperformed almost every market in the world. So what has this got to do in the current context? The current high of Nifty satisfies the minimum level required for wave 5 completion (approx equals wave 1). Also, if Nifty closes below 5452 today (farther from this the stronger the signal ), a moderately negative to highly negative candle will be formed on the weekly charts.

Looking at the USDINR crosses, a symmetrical triangle seems to be in play and the upper borders of this triangle shares a common boundary with a medium term trendline.  A convincing move above this level will mean more weakness for the Indian currency and as a corollary further weakness for the stock markets.
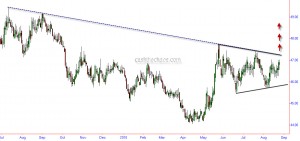
USDINR Daily Chart

My guess is that the Rupee will hit the upper borders today and pull back into somewhere into middle of the triangle to lower borders of the triangle, gather steam and then push past the 47.15 breakout level. If this scenario pans out - there might another push towards the high for the Nifty after the current decline. Let us see how the market pans out.

We were more focussed about going to cash and buying OTM puts as protection rather than going short between April and July. Considering that September is historically one of the weakest months, we will consider being short in a small way and try to build on them if situation warrants.
Jul 152010
 

Here is a chart of Indian Nifty in Dollar adjusted value.

Nifty daily chart - Dollar adjusted value

As is obvious from the above chart, Nifty has not even crossed the June highs, leave alone the April highs. And this could be the completion of a right shoulder in a head and shoulder top. While Nifty could very well continue to push higher and cross the highs of April in dollar terms- but other technical evidences at the moment do not favour that scenario. I guess by the time I post my next update from Singapore, markets should  have more evidence of which way they are headed.

Good trading to all!

Jul 112010
 

Hi everyone, I've been erratic with my posts and that will continue to be the case all through July. I'm relocating out of UK and my time and energy is focused on the relocation. Hopefully, by 1st of August Ill be all set in Singapore and updates on this blog should get regular.

Will keep updates coming as and when time permits until then.

Good trading to you all.

 Posted by at 10:44 pm
Jul 052010
 

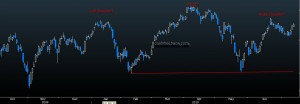
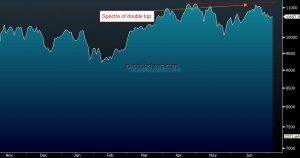
For the first time since 2009 cracks have started to appear amongst India's banking stocks. ICICI bank is showing considerable weakness and a close below 815 may weigh heavily on the banking index. HDFC bank is showing potential for a double top - of course this is not fatalistic but a close above 2025 will neutralise the negatives. A prudent investor/trader must watch the Bankex Index for clues to how the Indian markets are going to resolve.

BSE Bankex Line chart - Source Bloomberg

A close below 10100 for the Bankex would be a warning sign for further weakness in Banks and as a consequence for the broader indices - Nifty and Sensex.