Technical Analysis GBPINR – short term

 Currency  Comments Off on Technical Analysis GBPINR – short term
Mar 132014
 

The GBPINR cross may have established a base around 100 and seems set to move higher. A small star pattern followed by a bullish candle (similar to a morning star pattern) indicates that higher prices lie ahead. The zig-zag price movements are in harmonic ratios.  This is shown in the chart below. If the cross-rates sustains above 101.82 for an hour, traders may consider going long for an initial target of 103.8 and then 106.3. Use 100.8 at a daily closing level as stop.

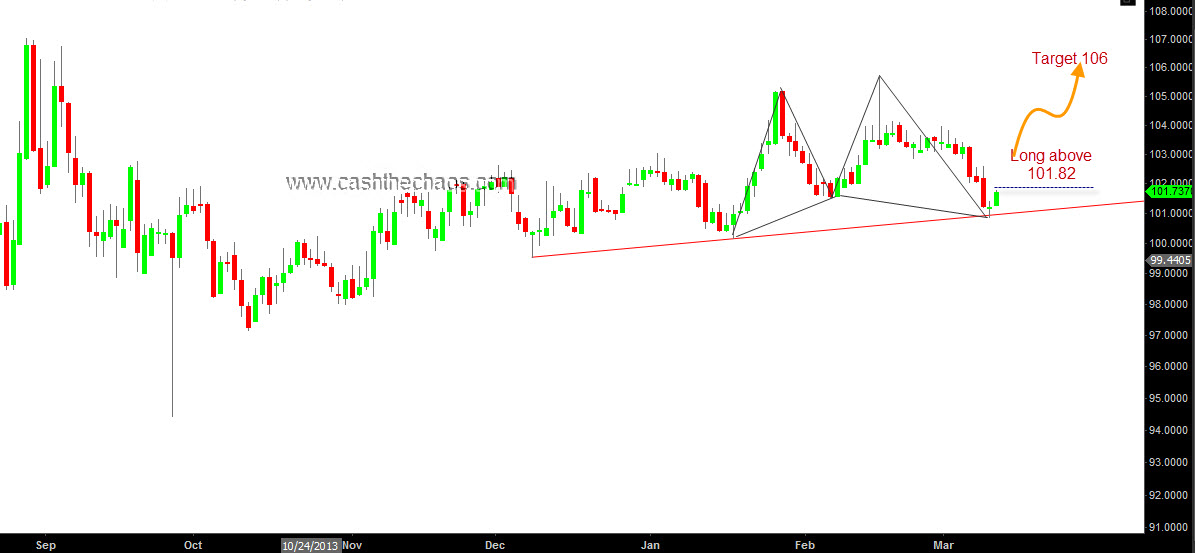
GBPINR Daily Charts with Harmonic pattern

Legal Disclaimer: This post gives an idea of how a trader chooses low risk entry points for trading and hence what you see in this post is for educational purpose only. This is no solicitation to buy, sell or hold any securities. I’m not a registered investment advisor and I strongly urge you to consult one if you are going to act on the above idea. If you decide to take action on the above idea, you are agreeing that you take full responsibility for the profit or loss that you may sustain based on such decisions and agreeing to indemnify the author of the same. You may have seen me on TV suggesting successful trade ideas but remember trading is inherently risky and past performance is no guarantee of future outcome.

Note: This was a premium post and has now been unlocked. Trade did not trigger as it did not sustain above 101.82 for an hour.

 Posted by at 1:19 am

Prepare yourself for a ‘sterling’ decline

 Currency  Comments Off on Prepare yourself for a ‘sterling’ decline
Feb 142013
 

Cable (GBP/USD) has been moving in a triangle pattern since 2009 and yesterday's sharp and convincing dip below 1.5630 marked the end of this triangle formation.

Pound sterling breaks out of a 4 year triangle

Cable's monthly chart (above) with its Elliott Wave count shows that the currency is embarking on its 5th wave of decline. The target for this breakout is mammoth - Over the next 12-24 months we are very likely to see a level of 1.345 at the very least but will not be surprised if we see a level of 1.165.

When such a large text book pattern comes to fruition, clearly there will be some economic/fundamental tail wind supporting it. We are not going to bother ourselves with those and will leave it to the economists to decode that for us. However, we need to be aware  that such a large movement in a major currency is unlikely to occur in isolation. The Dollar will very likely strengthen against other major currencies. This is terrific news for Dollar Index bulls and bad news for many risk assets including precious metals and equities that rely on weak dollar forever.

Disclosure: I'm short sterling since January 2013 from 1.6113.

Aug 262011
 

The Indian currency realised its triple bottom potential at the 43.85 level as the currency moved past 46 against the USD yesterday. The chart below shows the one year daily price movements of the currency and the bottoms are marked by the red oval. The price objective of the triple bottom pattern works out to a little over 48. Given that the stock markets are oversold and a bounce may come through for Indian stocks, INR could see a short-term pull back.

Indian Rupee - Triple bottom

If the currency pair ends today above 46.1 today (a weekly closing), it would be closing above its weekly "cloud" for the first time since August 2009. This would be another bearish sign for the Rupee (I recall turning bullish on the Rupee in April 2009.)

Indian Rupee - Weekly Ichimoku charts

In 2008, when INR closed above the "cloud", the Rupee weakness lasted several months until it peaked at the level of 52.18.

If we look at the movements of the INR from an Elliott wave perspective - it does look like USD/INR is in it's early stages of its powerful wave 3. The triple bottom low of 43.85 is just a shade over the 62% fibonacci retracement level of the move from the 2008 lows to the March 2009 high. This is a very common wave relationship.

Now comes the staggering bit - if my wave labelling is correct, the potential for the Rupee over the next several months, works out to at least a little over 57 and a typical wave 3 relationship would take the rupee to a level of 65!!!!

So there it is, another asset class that is closely related to the Indian stock market's price movements, reiterating the bearish case for India.