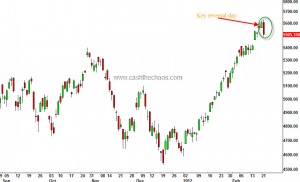
Nifty(5505):
Indian benchmark indices saw a key reversal day on the indices (see chart above). A new swing high followed by a strong rejection of the new high. This is usually very bearish but momentum points to an unfinished move. So, we will prefer a corrective decline followed by a another leg up.
BUT, if we see a "FIVE" along with this correction, we may have to conclude differently. As shown in yesterday's chart, the bigger B wave can end either at 5650 or slightly below OR closer to 5975. Yesterday's high was very close to 5650. Keep tabs on USDINR - if it crosses 49.8 that would the first warning sign for Bulls that things may not be smooth for them.
Supports: 5480, 5325 and 5077 (so watch for correction to get some support here - I prefer a decline 5325 to 5077)
Resistance: 5650
6 Responses to “Technicals 23rd Feb 2012”
Sorry, the comment form is closed at this time.

Hi Jai, Hope you have recovered fully. Could you please advise on Gold and Silver. Thanx
Gold should not have crossed 1765 but it has. That is a mild positive. But as long as it remains below 1805 the chances of downside is there. Abv 1805 new retest of 1960 or a new high would be on cards.
Jai,
Any stock specific inputs ? Maybe we should look beyond Nifty for pulling smart and profitable trades too.
Regards
hi jai,
lots of confusing signals, normally rupee depreciates on rising oil prices, euro has also gone up, data shows FII are still buying yet the market has corrected little bit, can you throw some light on this
regards
Jai,
As i had posted a couple of months back, most of our trades have been akin to shooting with a water pistol and we have missed the woods for the trees and as a result knickers are around our ankles.
regards
vivek
Dear Vivek,
If staying in cash is knickers down, I gurantee you – I’m naked most for most part of the year.
Cheers,
Jai