Oct 282011
 

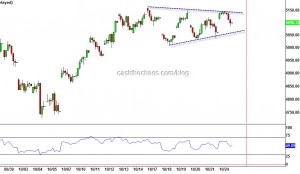
Nifty(5201.80): A break of the 8 week range of 4720-5160 came through on Tuesday - a breakout above the triangle that was highlighted on Tuesday. There is good news and bad news. The bad news for us is that this a breakout but the good news is that triangles more often occur at the penultimate leg of a move. While the validity of the Elliott wave count I have been maintaining since January is yet to get invalidated but looking at the market action in Europe and US, it does look like we will see a breach of 5329 on the Nifty and invalidate my preferred count.

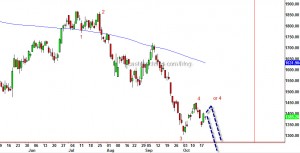
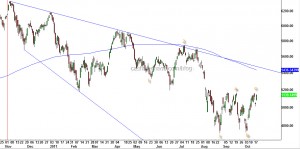
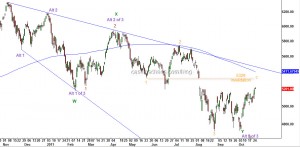
Nifty Daily Charts with EW count

The chart above outlines three possibilities, arranged in the order, least probable to the most probable:

1) Nifty does not violate 5329 and we maintain our preferred path

2) The bulls are back and markets are headed for a new all time high

3) Short-term rally continues to somewhere in the region 5400-5600 and a reversal comes through post that

The first scenario is straight forward - market is going to tell us right at the open. The other two scenario's we will reason out the why's and the why not's. On the charts this scenario is labelled using the Red and Orange numbers.

Scenario 2:  The bulls are back and this is shown on the charts above by W, X, Y marked in green. There are numerous problems here:

(a) This scenario essentially means that the bear market has completely spared index heavy weights like Hero Honda, M&M, ITC and Cement majors. I have never seen a bear market end with index components at or near 52 week highs.

(b) The 2008-2009 bear market ended with a double zig-zag pattern and the above labelling also calls for a double zig-zag. Markets rarely ever repeat in the exact manner and that too in the immediate cycle.

(c) At the bottom of a bear-market, markets do not trade at 18 times trailing earnings, it trades somewhere in the region of 10-12 times trailing earnings or even lower. When markets open tomorrow it will trading closer to 19 times trailing earnings - these levels are closer to a top rather than a bottom.

Scenario 3: This scenario is labelled with Alt 1, Alt2 in purple colour. This scenario is just a variation of  my existing wave count. Only the internals are different. Exactly for the above reasons outlined in Scenario 2, this is the most likely outcome. The INR is an important part of the equation here - the structure for the currency is such that we have only seen a partial portion of the currency weakness. Sharp rallies like we saw in Europe and US overnight serve 2 purposes - it cleans out the weak hands and helps in pushing the sentiment to extremes.  However, patience is the key. We do not want to be too early on the short side.

We will also try to capitalise on the short term energy and pull some swing trades. The aim would be to not linger too much on the long side.

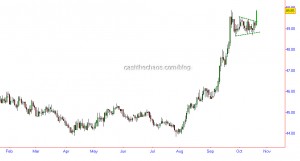
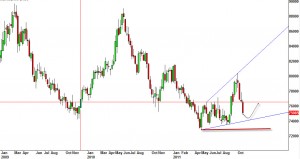
Dollar Index: The rally since the October low has been on weak dollar. There are quite a few possibilities for the dollar out here but the bottom line if the Dollar Index starts to reverse, RIP for the stock market rally. However, if the powers that be manage to push the dollar index below the red line shown, which I think is a low possibility, be prepared for a currency crisis or an inflationary holocaust.

Dollar Index - Daily chart

US stock markets: One sentiment measure I follow is now higher than it was when stocks where 6.5% higher in May 2011. This set up is normally associated with a market peak - it could be secondary or primary. Watch out as the market unravels.
 Posted by at 12:22 am
Oct 252011
 

Nifty(5098.35): The Asian region was strong, European and US futures higher and yet the Nifty faltered once again under the 5145-5177 zone. As mentioned yesterday, with a weak Rupee and 3 top heavyweights on Nifty under pressure, clearing above critical resistance was never an easy task. As should be expected, the momentum behind this move is also weak. Having said that, the thrust downwards at this moment is also lacking fire power. As can be seen from the chart below its a narrow triangulation between the bullish and bearish forces.

Nifty - Hourly charts

A move beyond these borders is needed for a decisive move.

Nifty short term:- While the range is 5160-5010, a break below 5040 would be an early indication that 5010 is about to go.

A couple of interesting points from the Global markets.

S&P Daily Charts

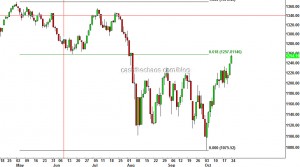
Yesterday's high on the S&P and the Dow Industrials are exactly at the 61.8% fibonacci retracement of the entire decline from May. The french CAC too has paused at 38.2% fibonacci retracement of its fall from the summer highs and the DAX a few points above the 38.2% fibonacci retracement. Dr. Copper is just a few cents away from a perfect A = C wave relationship. While these levels are not fatalistic and markets need not halt here but it is interesting that we have such decision point levels right at the time when markets are at cross roads. A strong sell off for the US and European and US futures during the Asian session would be quite meaningful and would possibly signal a reversal is at hand.

Strategies yet to achieve their price objectives:

Strategy Security Price Entry Price Objective Stop loss Remarks
Larsen Short 1397 1235,1105 1450; moved to 1400 Partial profit booked at 1331
Long Ambuja Cem 154 170, 188 142 at a daily closing level
Short Wipro 347 305, 290 365 at a daily closing level
TCS Write 1150 Nov Call Around 10-11 0
 Posted by at 2:39 am
Oct 242011
 

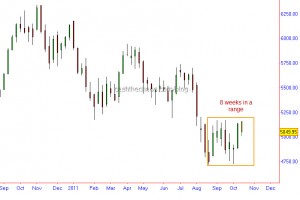
Nifty(5049): Indian markets were locked into the range of 4720-5160 on the Nifty for the eighth consecutive week.

Nifty - weekly charts

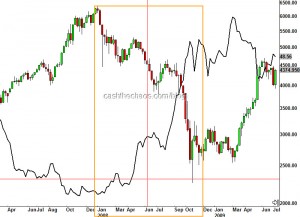
The important take away has been that heavyweights TCS, Reliance and Larsen have formed negative candles within this range and Larsen is at the threshold of clocking a new low for the year. We also have the Indian Rupee at verge of striking the all time low it made in 2008. While a strong Rupee is not a pre-requisite for the Indian markets to rally, see the INR vs Nifty charts below the orange rectangle, blackline being rupee. Given this backdrop, the chances for Nifty to push much beyond the recent swing high is a tall order and just a small negative trigger is what is needed to tip the scales.

INRvsNifty

If you are wondering what that trigger could be: It is the Euro and the Euro zone. A quick look at the charts of the European bond markets seems to indicate that their plans are dead before arrival. While the equity markets have been rallying over the last few weeks, the 10 year bond yields of Spain, Italy have been rising. And no, this is not a risk on trade. Their yield spreads to German debt is widening. And the most telling fact is that the french spreads to the german bunds is at a 2 decade high!! Essentially, the while the European leaders are trying to sort the problem of Greece and Italy, the bond market is signalling that the crisis has arrived in France. (Sorry no charts) Watch out, the Euro has opened 0.25% lower this morning.

Nifty short term: The range of 5030-5140 might hold for the day. Any dip below 5030, is likely to take this market to 4970.

 Posted by at 1:46 am
Oct 212011
 

Nifty(5091): Perhaps the most significant price action yesterday was the movement of INR. We have already seen during this results season how the treasury departments of many companies are so ill-prepared for the weakness. TCS and Bajaj Auto are glaring examples.

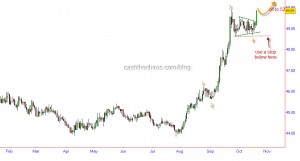
INR - triangle breakout

Now with the rupee set for further weakness to 52 the problems are going to compound. Use a stop below 48.6/48.3 as a stop if you are going to play for the short-term.

So far Nifty has been all over the place this week, probably the currency weakness is coming at the right time and can provide the kicker needed to provide the short-term trend shift. The zone of 5125-48 should not crossed in today's session, if it does, this market is still not YET ready to go down.

As pointed out yesterday on CNBC, if the Euro drops below 1.3670 it will be a good confirmation signal that the stock markets including Nifty are heading lower. Incidentally, the low on Euro yesterday was 1.3672!!

Keep an eye on L&T in today's session. This stock has a potential to surprise to the downside given the position at which it is in charts. Yes I did say it might spend time between 1450 and 1300 before heading lower (in the comments section). But be prepared, today it is set to announce its results.

LT -Daily Charts

The clue comes from wave 4 shown on charts. It is just a couple of points above 25% retracement. That is a very weak signal. If the wave 4 has ended here, the next wave 5 push should take it to at-least 1235. Either use 1450 as a hard stop (punch it in the system) or play an Out of the money November put or just sit out.

 Posted by at 3:08 am
Oct 202011
 

Nifty(5139): Tuesday's sell off was completely neutralised and once again the focus has shifted back to the critical 5175-5200 zone. It is always important to keep an eye on where we are in the larger trend. So, here goes:

Nifty Daily Charts

We already know that in the medium term the bearish trend does not have a problem as long as Nifty stays below 5330. The structure marked on the chart is what is called a "flat" which has a tendency to exceed slightly above the high of "a". The 50% fibonacci retracement point of the move from the Aug high is at 5230 and we might want to keep this as important level for reversals.

The alternative view is that, what if the point we have marked as "b" is actually a truncated 5th? One of the long-term possibility is that the bulls are back for the long-term (Nifty should exceed 5177) - this seems pretty incongruous based on several measures I follow. While you need to be aware that such a scenario exists, you might also want to be aware that this rally could extend to the 200DMA (about or the blue trend line shown on the chart (5400+ zone) and still be in a bear market. We will be using a different count in that case. We will discuss on a separate post when the need arises with charts and the works.

So it is important to understand that we should NOT make any large commitments on either direction of the market. Keep your positions to a manageable level.

The Euro seems to have put in an important secondary high 2days back and with a tight correlation with global stocks over the last few months this is going to be an important thing to watch out for. A decline to 1.3550-1.3575 seems likely and anything below that would mean that fuel for the bulls have gone empty.

Nifty short-term: Watch out for 5110-5085. Below this zone a quick 50 point decline could come through. If any intra-day traders out there, you might want to pay attention to this.

On CNBC, today at 8:20 IST.

 Posted by at 12:37 am
Oct 172011
 

Nifty(5132): The short-term divergences in the charts are getting more pronounced. This is analogous to an auto mobile continuing on its path without fuel but on residual motion.

Nifty -intraday chart

I can also count a small degree wave 5 that is nearing completion. Volume footprint tells us that the area of 5090 and 5070 is very crucial and might act as the bull-bear divide in the short-term. Since the previous day's low is just slightly below this level at 5056 that must the stop for those who are long on the market.

Remember, the larger trend is still down as long as the market is still below 5330. With Nifty already near 5200, and significant overhead resistances ahead, the probability that this market will head much higher looks very low. At the same time, a significant decline also seems like a low probability before October 25th . Hence, we will pull a nuetral strategy on the market with the outer-perimeter in mind.

Nuetral Strategy- Bear Strangle:

Write n contract(s) Nov 24th 2011 5200 call at or near 45 and Simultaneously write n contract(s) Nov 24th 2011 4700 put at or near 136.

Margin Required: Aprrox Rs 32000/strangle

Credit Recieved: Aprrox Rs 177

As long as Nifty remains between 4523 and 5377 the strategy will make money.

At October expiry the strategy is likely to yield a profit of Rs 30/strangle - roughly 10% on the margin paid.

 Posted by at 2:45 am
Oct 162011
 

Inter-market analysis provides an extra dimension to technical analysis - the peripheral vision and the backdrop in which we are operating. Here is one such inter-market factor. To me this is pretty much like looking at the charts of the Baltic Dry Index.

Over the last few weeks if you have been left wondering if the markets around the world have turned a corner, you might want to have look at the following pictures.

Vessels backlog 1

Vessels backlog - view from my Condo

Cargo backlog 2

Please click on these pictures and have a larger view. As you might understand from the caption, these are cargo vessels that have been standing idle for months together here in Singapore and some might be more than a year. The number of vessels over the last few months have only increased albeit at an alarming pace. Talk to anyone in the shipping business they would tell you what these pictures are telling. I personally know someone who owned a ship and went bankrupt - their next generation is still trying to pay off the debts and in all likely-hood, that person is unlikely to pay off the debt until their retirement age. The same would be true of corporations. In short, this is not a cheerful sign.

Singapore backlog - a small video clipping of the ECP coast (singapore).

 Posted by at 3:03 pm
Oct 142011
 

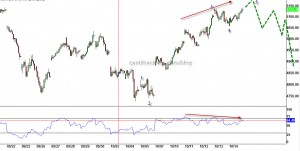
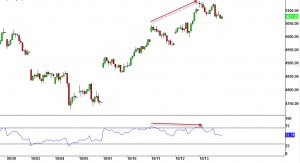
Nifty(5077): Nifty opened near the high of the day but ended right near lows of the day. Was that the end of the corrective rise? Possibly. The next couple of sessions are going throw some vital clues. The intraday chart for Nifty is shown below:

Nifty - intraday chart

We can see very clear divergence between the price at the top and momentum shown at the bottom pane. Normally, these are precursor to a change in trend. In opening trades, if we see Nifty rise but struggle under 5127 (spot) or even 5105, this might be another sign that the corrective rise from 4728 to 5136 may have run its course. We will see if we can pull a short-term trade in that case.

Volume footprint : 5040-5010 zone needs to be taken out for bearish play.

 Posted by at 2:47 am