I'm posting this update on Nifty from my holiday spot in Bangkok, so this will be short.
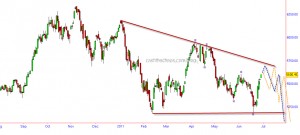
On the charts above, note those small violet squares (you may want to click on the chart for a zoom) that mark the swing highs and lows. This is how waves progress, each move moving beyond the extremes of the previous move and in a five step fashion. So, I'm treating the current move as a corrective move to the decline of 5944 to 5195 and not as a trend change. If you heard me on CNBC on 20th June, the day markets hit 5195, I had expected a reaction to 5485 but this one has been stronger than that. Nevertheless, it would have prepared you to go slow on the bearish side.
Going ahead, the rise from the June 20th low should remain "a three" for the bearish case. Hence, we should expect Nifty to start reacting lower from the red trendline marked on the chart (5720 and falling by 5 points each trading session) - which would raise the prospects of a descending triangle OR react lower from 5660's. Either case, I would NOT put my feet back on the bearish pedal atleast till I see a lower high registered. I have plotted a couple of possible routes on the chart.
Signing out, until my next update from Singapore - man, its really hot here!
7 Responses to “Pressure points for Nifty”
Sorry, the comment form is closed at this time.

hi jai
hi jai i have taken nifty shorts at the level at 5400.do you still feel that by mid july it could go to 4800.
regards
rakesh.
Jai,
Thanks. I am feeling hot under the collar…..This uptrend was unexpected to say the least.
In one of your last comments you had mentioned SBI to bounce to 2400. It did…I guess based on your recent comment best to stay away from shorting it now.
I have been running short on the Nifty from 5475. Should I hold on ?
BTW : A heat wave in Munich. Suddenly raining Bombay seems a good place to be in……getting back.
Have a great holiday
Regards R
Hi Rut,
Here is a small suggestion. When trying to catch turns, try to see if the security is trying to come under pressure at the expected resistance, atleast on hourly charts or 1/2 hourly charts. (Look for a red bar). You dont need any expensive live feed – yahoo provides it free 🙂 If the security is not coming under pressure, avoid.
In the present situation it does look like, mkt could be against you by for a few more hours of trade. There are 2 options I see here: 1) Get out and get back in when the pressure starts, (2) hedge with calls and lift the hedge when the pressure starts. Depends on your comfort. Remember there is cost of hedging too.
Good luck.
Cheers,
Jai
hi jai
you are good and great analysts
that punjlloyd move to77. how can i watch your recommendation. i am small investor
Hi Suresh,
Thanks. I’m on CNBC every alternate week, either on Wed or Thurs(next one on 7th July Pre-open). Please understand that I do go wrong sometimes – though I’m more often right than wrong. The important thing to keep in mind is to keep ur risk low and as a result when you go wrong, it comes out of your correct trades and not from your capital. So when you see any opinion of my mine – please try to figure where to place your stops.
Good trading to you.
Cheers,
Jai
Jai,
After today do u see that this chart is playing out ?
Obviously, I would love that this comes true . . . . 😉
Regards
Rut,
It was a beautiful set up on the intraday charts. I wish you had seen it. Will post that next.
Cheers,
Jai